From Water Data to Water Savings: How IoT Platforms Improve Resource Efficiency

Table of Contents
- Water Conservation Starts with Real-Time Visibility
- Why Water Wastage Often Goes Unnoticed?
- How an IoT Water Monitoring Platform Works?
- How Real-Time Water Data Can Lead to Savings?
- How thingZmate® Supports Smarter Water Conservation?
- Where IoT Water Monitoring Creates Operational Value
- How to Measure Water Savings with IoT Analytics?
- Turning Water Monitoring into Long-Term Resource Efficiency
Water Conservation Starts with Real-Time Visibility
Water does not have to gush from a broken pipe to be wasted. It can disappear quietly through persistent overnight flow, overflowing tanks, inefficient irrigation or unexplained use along an industrial production line. Traditional water meter readings reveal how much was consumed, but they rarely show exactly when an avoidable loss began or what changed. An IoT water monitoring platform closes that visibility gap by bringing connected measurements into a system that makes water usage easier to interpret. Facility teams can compare consumption across hours, buildings and processes, identify patterns that deserve attention, and check whether interventions worked. The platform does not physically save water by itself; it helps people and connected systems make more informed decisions. Real resource efficiency begins when reliable data leads to action and measurable results.
Why Water Wastage Often Goes Unnoticed?
Even metered facilities may not know where water is being lost. In residential buildings, water usage monitoring and conservation becomes difficult when readings remain scattered or inaccessible to facility teams. Without timely, contextual monitoring, problems can persist between manual readings:
- Continuous flow during unoccupied hours, suggesting a possible hidden leak.
- Tank levels approaching overflow without an operator noticing in time.
- Pumps running longer than expected because of an operational fault.
- Unexpected consumption spikes that disappear into monthly meter totals.
- Irrigation volumes that do not match actual site requirements.
- Different buildings or process zones consuming far more water than expected.
- Completed repairs with no baseline to prove that consumption actually decreased.
How an IoT Water Monitoring Platform Works?
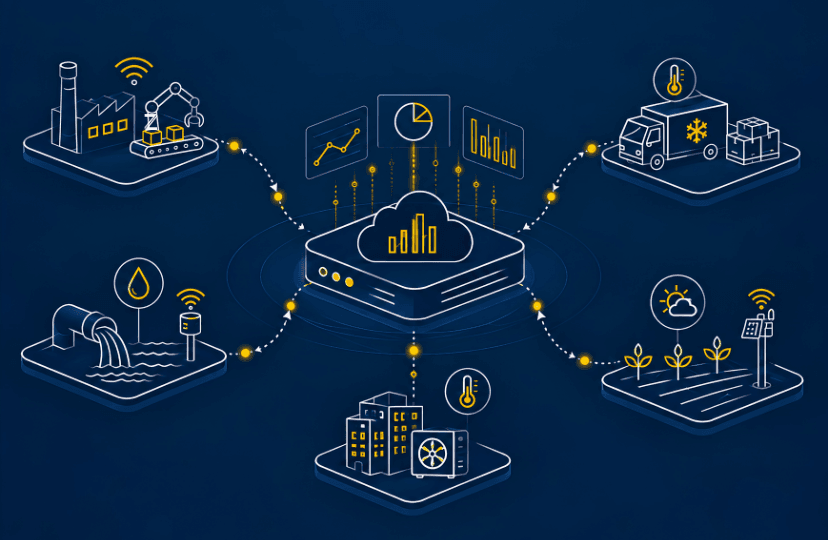
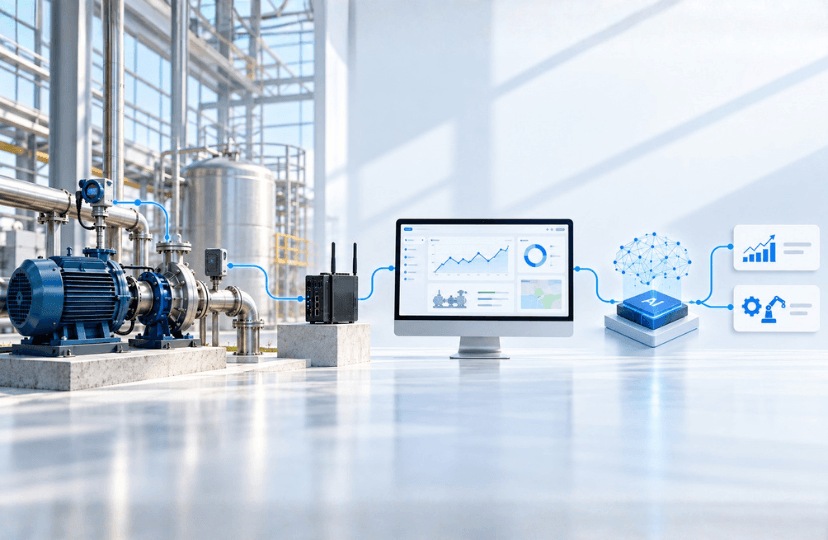
Connected water meters and sensors provide the measurements; the platform helps turn those readings into operational information. Flow, cumulative consumption, tank level and pressure can be monitored through appropriately selected instruments and compatible connectivity, with readings organized by asset, zone and site.
From measurement to an informed response
- Measure flow rate, totalized water usage, tank level and pressure where instrumented.
- Transmit readings through compatible gateways, networks or platform integrations.
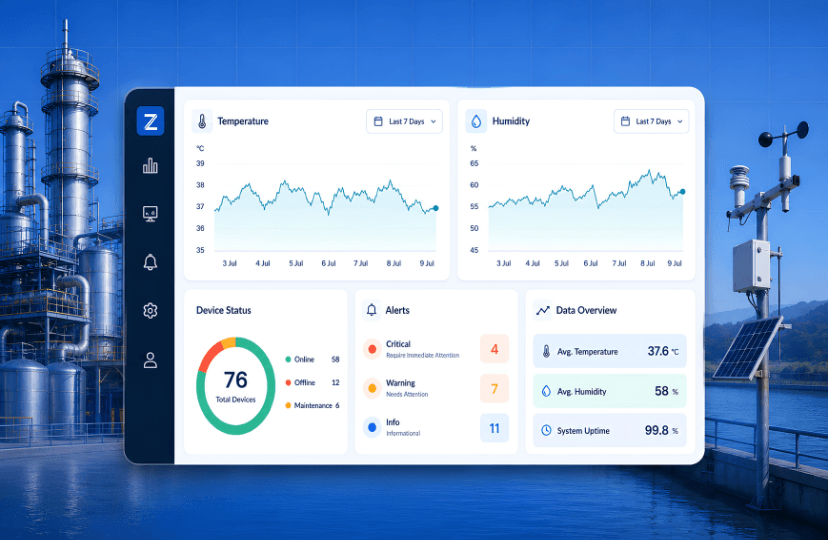
- View current conditions and historical trends in centralized dashboards.
- Compare water demand against schedules, production activity and normal operating ranges.
- Configure alerts for sustained flow, unusual consumption or defined level thresholds.
- Investigate the cause, correct it and review subsequent data for improvement.
How Real-Time Water Data Can Lead to Savings?
A monthly bill may show rising consumption without revealing when it began. Time-stamped data can reveal unusual overnight flow, tank-level rises and water use continuing after scheduled activities have ended. Those patterns indicate what to investigate; they do not prove a leak.
Evidence from a connected township deployment
In a smart township water monitoring project, EnthuTech used water meters, tank-level sensing and configured alerts. thingZmate® brought readings and historical trends into one dashboard. Operators could respond sooner to overflow risks and abnormal usage. The published case study reports reduced water wastage and faster responses. It demonstrates how platform visibility can support operational water savings.
How thingZmate® Supports Smarter Water Conservation?
As a configurable IoT platform, thingZmate® can bring readings from compatible field devices into a common monitoring environment. Supported connectivity and data integrations, including LoRaWAN, MQTT and HTTP, help teams access relevant water information without relying on isolated displays.
Capabilities that help teams act on water data
- Centralized dashboards display flow, tank level and other configured measurements.
- Configurable events and alerts highlight defined conditions requiring attention.
- Historical analytics support investigation of recurring peaks and usage patterns.
- Reports help compare water consumption across sites and monitoring periods.
- Event-based workflows support defined responses when the deployment is integrated appropriately. For example, a high-level alert can prompt staff to investigate a tank's inlet or pump operation before overflow occurs. The actual savings depend on responsive site procedures, reliable instruments and corrective action.
Where IoT Water Monitoring Creates Operational Value
- Industrial facilities: compare process-water use across shifts and production areas.
- Commercial buildings: investigate consumption outside expected occupancy hours.
- Apartments and communities: follow sump and overhead tank levels to limit overflow risk.
- Hospitals and hotels: review high-demand utilities and continuous-use fixtures.
- Campuses: compare buildings and confirm the effect of maintenance improvements.
- Agriculture: review irrigation volumes alongside schedules and available soil readings.
- Water utilities: investigate unusual zone-level flow and pressure changes.
- Food processing operations: understand cleaning, cooling and production-water consumption.
How to Measure Water Savings with IoT Analytics?
Metrics that connect monitoring to efficiency
- Total water use in cubic metres (m³) by day, month, building or zone.
- Minimum overnight flow during periods when demand should be very low.
- Frequency and duration of unusual-flow, pressure or high-level events.
- Water intensity per product, occupant or irrigated area where comparisons are meaningful.
- Differences between incoming supply and metered end uses where coverage permits.
- Time from an alert to investigation, repair and operational recovery.
- Before-and-after consumption under comparable production and occupancy conditions.
- Missing data, device availability and meter accuracy that affect confidence in findings.
- Pump run time and related energy demand when those parameters are also measured.
Turning Water Monitoring into Long-Term Resource Efficiency
Build a baseline before setting targets
Start with correctly specified meters, verified calibration and consistent units. Collect representative data across shifts, weekdays and seasonal operating changes. Place submeters at high-consumption areas if overall totals hide individual losses. Assign ownership for alerts so exceptions lead to field checks, not ignored notifications. Account for demand changes before describing lower consumption as verified savings.
Make every insight part of an improvement cycle
- Define realistic usage ranges for each location or operating condition.
- Review abnormal readings alongside schedules and equipment operating status.
- Verify faults on site; unusual flow can have more than one explanation.
- Record corrective action, then compare equivalent periods to assess the result.
- Repeat the review cycle; lasting savings come from action, not dashboards alone.
Table of Contents
- Water Conservation Starts with Real-Time Visibility
- Why Water Wastage Often Goes Unnoticed?
- How an IoT Water Monitoring Platform Works?
- How Real-Time Water Data Can Lead to Savings?
- How thingZmate® Supports Smarter Water Conservation?
- Where IoT Water Monitoring Creates Operational Value
- How to Measure Water Savings with IoT Analytics?
- Turning Water Monitoring into Long-Term Resource Efficiency
Keep Exploring Our Blog Collection
© 2026, Enthu Technology Solutions India Pvt. Ltd. All Rights Reserved.